Summary: What’s impacting the markets?
The first half of 2023 provided investors with a much-needed market rebound. Consumer sentiment is trending upward, and unemployment, at 3.6%, remains well below long-term averages (1). GDP grew by 2.4% in the second quarter, beating market estimates of 1.8%, an indication that consumption remains strong regardless of higher interest rates (2). Globally, the long-awaited Ukrainian counter-offensive executed in June fell dramatically short of reaching the front lines (3). Biden signed the Fiscal Responsibility Act of 2023, expanding the debt ceiling in exchange for capped federal spending programs through 2025. Correspondingly, Fitch Ratings, one of the world’s top credit rating agencies, downgraded the US government’s credit rating from AAA to AA+ quoting “the erosion of governance over the last two decades that has manifested in repeated debt limit standoffs and last-minute resolutions” (4).
Equity Markets:
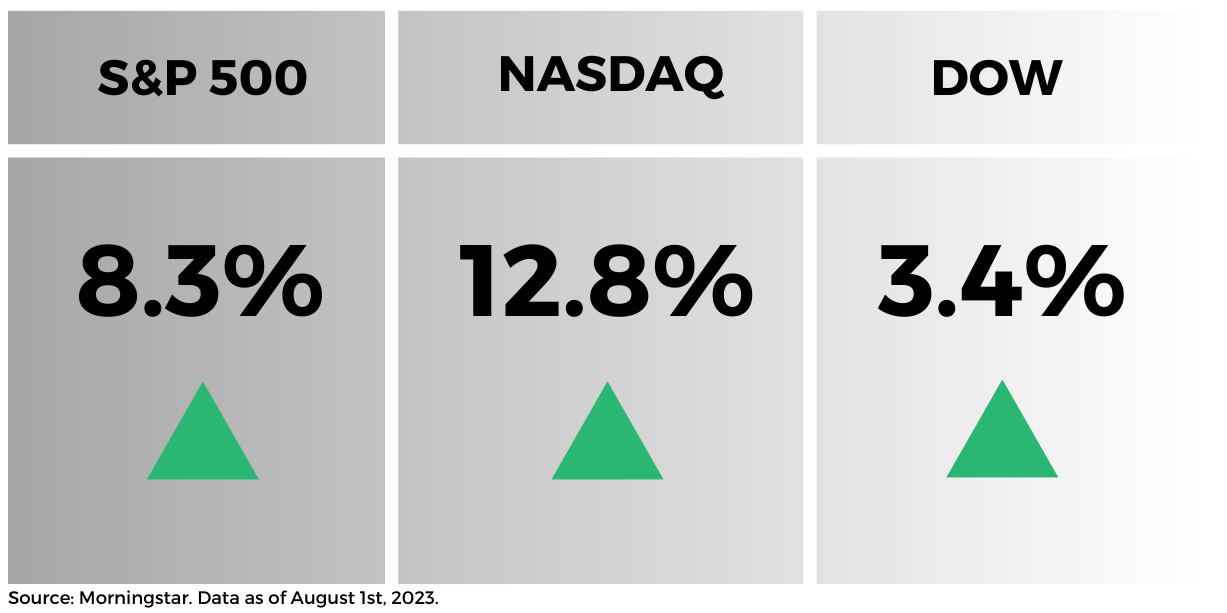
The S&P 500 continued to gain steam in Q2 of 2023, completing its third straight quarter of gains – though the dispersion between gains was significant. Seven mega cap U.S. companies have accounted for 70% of the S&P 500 gains YTD (2). While money markets continue to offer attractive yields and cash holdings reached near-record highs in Q1, many investors found themselves sitting on the sideline through the equity market rebound (5). This presents a considerable challenge to investors who chose to sell and hold cash: determining the correct time to re-enter the market.

Inflation:

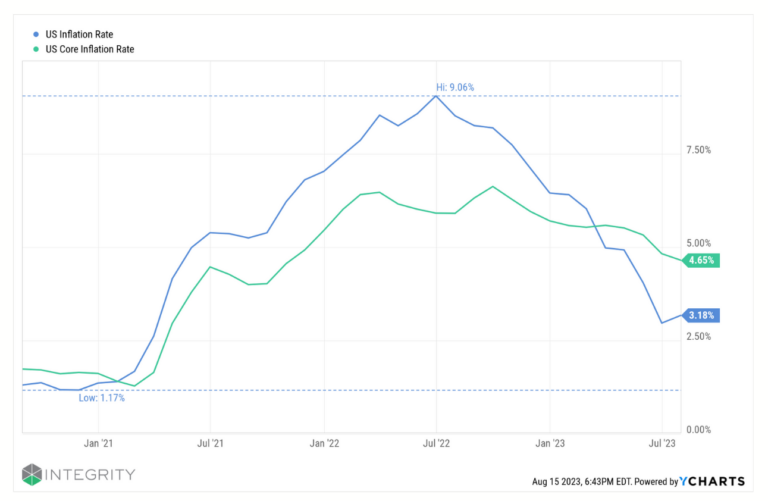
Inflation news has finally turned more positive. After peaking at over 9% in June of 2022, headline inflation eased to 3% year-over-year in June 2023, while core inflation (CPI excluding food and gas) remains above average at 4.83% (2). The fed’s aggressive rate hikes eased in Q2, perhaps signaling we are nearing the end of this rate cycle.

Inverted Yield Curve:
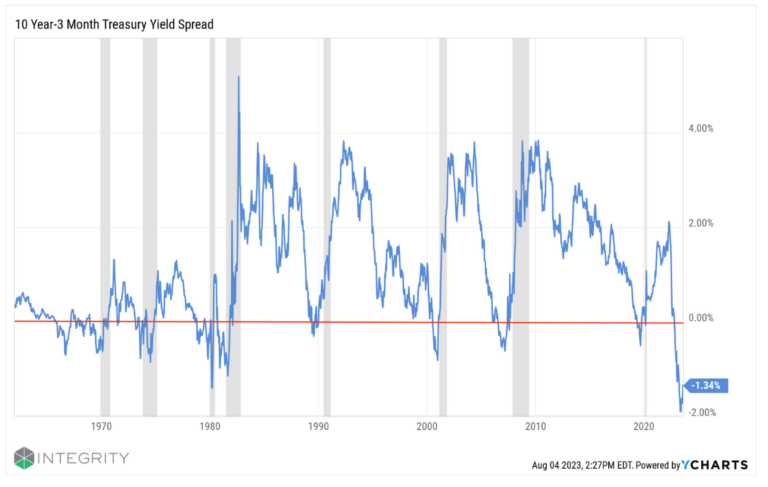
Despite the shift in optimism, treasury markets continue to signal a recession, pushing the 3-month treasury yield well above the 10-year treasury yield. This inversion is illustrated by the spread falling below the red line. Historically, there have been eight inversions since 1960 and each instance ultimately led to a recession (highlighted with grey bars). As interest rate hikes produce delayed effects on the economy, the average time from inversion to recession is 15 months. Despite the warning signal, many economists have lowered estimated probabilities of a recession – suggesting a potential soft landing.
Sources:
(1) https://ycharts.com/indicators/us_consumer_sentiment_index
(2) FS Investments, Q3 2023 Economic Outlook Sailing into the slowdown
(3) https://www.vox.com/23819064/ukraine-war-counteroffensive-russia-mines-tanks
(4) https://www.fitchratings.com/research/sovereigns/fitch-downgrades-united-states-long-term-ratings-to-aa-from-aaa-outlook-stable-01-08-2023
(5) https://cnbc.com/2023/01/18/investors-are-holding-near-record-levels-of-cash-and-may-be-poised-to-snap-up-stocks.html
Disclosure:
Past performance is not indicative of future results. The opinions expressed are those of the Integrity Financial Corporation (“Integrity”) and should not be taken as financial advice or a recommendation to buy or sell any security. Integrity is a registered investment adviser. Registration does not imply a certain level of skill or training. Any forecasts, figures, opinions or investment techniques and strategies described are intended for informational purposes only. Past performance is not indicative of future results. Investing involves the risk of loss of principal. Investors should ensure that they obtain all current available information before making any investment. Indices cited in the information above are intended to support the opinions expressed and are shown as general examples of market trends. It is not possible to invest directly in an index and the volatility of the index may vary from that of an investor’s actual account. Note that index performance shown does not take into account management fees and is not intended to be indicative of future results. Additional information about our investment strategies, risks, fees, and objectives can be found in Integrity’s Form ADV Part 2. The opinions referenced are as of the date of publication and are subject to change due to changes in the market or economic conditions. There is no guarantee of the future performance of any Integrity Financial portfolio. Material presented has been derived from sources considered to be reliable, but the accuracy and completeness cannot be guaranteed. Nothing herein should be construed as a solicitation, recommendation, or an offer to buy, sell, or hold any securities, other investments or to adopt any investment strategy or strategies.


